The 540 nm Signal That Sees What Enzymatic Cascades Miss
Carbohydrate quantification sits in an uncomfortable position within the metabolism laboratory. It is simultaneously among the oldest biochemical measurements in existence and among the most frequently performed incorrectly. Walk through any poster session on plant stress physiology, cancer metabolism, or microbial fermentation, and you will find bar graphs plotting total carbohydrate content against treatment conditions—drought, chemotherapy, carbon source limitation—with error bars that look reassuringly narrow and asterisks that cluster around the expected time points. But in too many laboratories, what the graph actually displays is not a total carbohydrate measurement. It is a partial carbohydrate measurement that the investigator has accepted as total because the assay they used—typically an enzymatic cascade that detects glucose and perhaps maltose—is blind to the polysaccharides, glycoproteins, and complex oligosaccharides that constitute a substantial fraction of the total carbohydrate pool in biological samples.
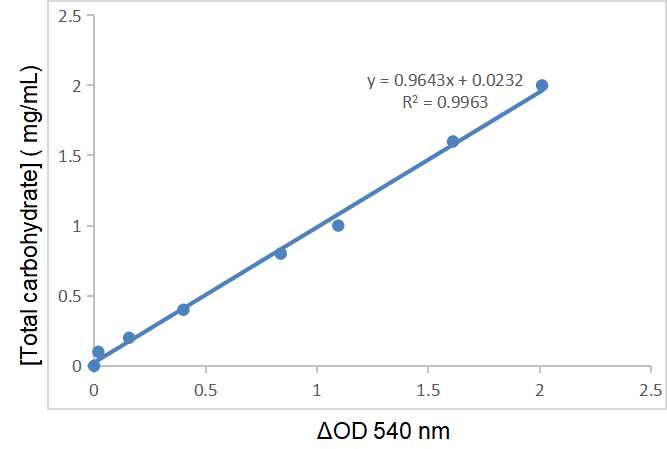
The detection chemistry inside Abbkine's CheKine™ Micro Total Carbohydrate Assay Kit (KTB1350) addresses this specificity gap by going chemical rather than enzymatic, and the choice is biochemically decisive. Total carbohydrates in the sample are first hydrolyzed by hydrochloric acid into reducing sugars. These liberated reducing sugars are then heated with 3,5-dinitrosalicylic acid (DNS) reagent under alkaline conditions, reducing the DNS to generate amino compounds that produce a characteristic reddish-brown color in alkaline solution with an absorption peak at 540 nm. The absorbance at 540 nm is linearly proportional to the reducing sugar content within a defined concentration range, and the total carbohydrate concentration in the original sample is calculated from a standard curve. No glucose oxidase. No hexokinase. No amyloglucosidase that partially hydrolyzes starch and then stops. No coupled peroxidase reaction that is inhibited by the phenolic compounds and reducing agents present in virtually every plant extract and bacterial lysate. The DNS method converts the entire hydrolyzable carbohydrate fraction—glucose, fructose, maltose, lactose, sucrose hydrolyzed to its constituent monosaccharides under the acidic conditions of the assay, maltose that hydrolyzes under the same conditions, and starch that partially hydrolyzes—into reducing sugars that then react stoichiometrically with the DNS reagent to generate a signal that reflects the total, not a selected subset.
This is not a new chemistry. The 3,5-dinitrosalicylic acid method has been a workhorse of carbohydrate analysis for over a century, and its reaction mechanism is textbook: the yellow DNS reagent reacts with the carbonyl group of reducing sugars to form 3-amino-5-nitrosalicylic acid, a brick-red compound, in a one-to-one stoichiometry. What KTB1350 changes is not the chemistry but the packaging. The DNS reagent that most laboratories prepare fresh for each experiment—weighing 3,5-dinitrosalicylic acid powder, dissolving it in sodium hydroxide, adding potassium sodium tartrate, heating, filtering, and protecting from light—arrives pre-formulated, pre-stabilized, and pre-validated. The hydrochloric acid hydrolysis step that converts non-reducing sugars and polysaccharides into detectable reducing sugars is performed with a reagent included in the kit at a controlled concentration. The sodium hydroxide neutralization that follows the acid hydrolysis step is similarly included. The result is a four-component kit—Hydrochloric Acid, Sodium Hydroxide, DNS Reagent, and a Standard—that replaces a reagent-preparation workflow that consumed the better part of a morning and introduced batch-to-batch variability exceeding 15% in inter-laboratory comparisons.
Sample compatibility in KTB1350 spans the matrices that carbohydrate researchers actually use: plant tissues, animal tissues, serum, and plasma. The inclusion of plant tissue is not a marketing afterthought. Plant cells contain vacuolar stores of phenolics, alkaloids, and terpenoids that interfere with enzymatic detection methods by inhibiting peroxidase or by reducing the hydrogen peroxide generated by glucose oxidase. The DNS method sidesteps these interferences because the acid hydrolysis and alkaline DNS reaction proceed under conditions that denature and degrade most interfering compounds, and because the detection signal at 540 nm is generated by a direct chemical reaction between DNS and the reducing sugar carbonyl group—not by a coupled enzymatic cascade that can be derailed at any of its multiple steps. A 2021 study on dragon fruit-derived sugar samples confirmed that DNS-based UV-Vis spectrophotometric quantification delivers results statistically equivalent to HPLC for total sugar determination in complex plant matrices. For the plant physiologist comparing carbohydrate allocation between drought-tolerant and drought-sensitive cultivars, this means the total carbohydrate number on the graph represents the actual carbohydrate content of the leaf tissue, not the fraction of that content that survived passage through an enzyme cascade that plant secondary metabolites partially inhibited.
A critical clarification about the detection principle deserves explicit articulation because it resolves an apparent contradiction between the product page specification and a separate Abbkine blog post describing the kit. The blog post describes a phenol-sulfuric acid-based method with detection at 490 nm. The product page and distributor documentation consistently specify the DNS-based method with detection at 540 nm—a wavelength distinction that matters, because the phenol-sulfuric acid chromophore absorbs maximally at 490 nm while the DNS chromophore absorbs at 540 nm. Both are validated colorimetric methods for total carbohydrate quantification. The phenol-sulfuric acid method dehydrates carbohydrates to furfural derivatives using concentrated sulfuric acid, then condenses those derivatives with phenol. The DNS method reduces 3,5-dinitrosalicylic acid to 3-amino-5-nitrosalicylic acid under alkaline conditions. Both achieve the same analytical goal—total carbohydrate quantification—through different chemical routes. The product page specification is the authoritative reference for KTB1350: DNS-based detection at 540 nm, with the kit components including Hydrochloric Acid, Sodium Hydroxide, DNS Reagent, and Standard. The blog post describes a different detection wavelength (490 nm) and reagent system (phenol-sulfuric acid) that does not match the product specification. Researchers using KTB1350 should follow the product page protocol: acid hydrolysis, DNS reaction under alkaline heating, detection at 540 nm.
The operational demands of the DNS method as implemented in KTB1350 are what make it feasible for population-level phenotyping rather than boutique analytical chemistry. The acid hydrolysis step converts polysaccharides and non-reducing sugars to reducing monosaccharides. The DNS reaction proceeds under alkaline conditions with heating, producing the reddish-brown chromophore. The absorbance is read at 540 nm on any standard visible-wavelength microplate reader—no UV capability required, no fluorescence detector, no mass spectrometer. The protocol explicitly notes that the kit cannot achieve 100% degradation of cellulose, a limitation shared by all acid-hydrolysis total carbohydrate methods that are not designed to solubilize crystalline cellulose microfibrils. This is not a flaw; it is a biochemically honest specification that tells the user what the kit measures (hydrolyzable carbohydrates excluding crystalline cellulose) and what it does not measure (structural cellulose). For the plant cell wall biologist who needs to quantify cellulose separately, a dedicated cellulose assay is the appropriate tool. For the metabolism researcher quantifying soluble sugars, starch, and hydrolyzable polysaccharides, KTB1350 captures the fraction that matters.
The broader research landscape makes the case for reliable total carbohydrate quantification more compelling than most experimental designs acknowledge. Carbohydrates are not merely metabolic intermediates. They are the primary products of photosynthesis, the carbon skeletons that plants allocate between growth, storage, and stress tolerance. When a plant physiologist exposes Arabidopsis to progressive drought and measures soluble sugars, starch, and total carbohydrate content, the total carbohydrate measurement is the reference against which allocation shifts are calculated. A 2022 review in Food Chemistry noted that accurate, direct, and reliable carbohydrate analysis is essential for food science and plant biology, and that the anthrone-sulfuric acid method—a chemical method closely related to the DNS approach—remains the most commonly used colorimetric method for carbohydrate determination because of its simplicity, sensitivity, and resistance to interference. The DNS method shares these characteristics while offering the additional advantage of a detection wavelength (540 nm) further removed from the absorption maxima of common biological pigments.
In oncology, total carbohydrate content in tumor tissue reflects the accumulation of glycogen, glycolipids, and glycosylated proteins that accompany malignant transformation. Cancer cells hoard glycogen at levels that can approach those of normal liver, mobilizing it under glucose deprivation or chemotherapy stress to fuel glycolysis and the pentose phosphate pathway. Glycogen metabolism is dysregulated in cancers of the kidney, ovary, lung, bladder, liver, blood, and breast. Total carbohydrate quantification in tumor lysates provides a screening parameter for metabolic reprogramming that transcript-level measurements of glycogen synthase or glycogen phosphorylase cannot supply—enzymes that are regulated primarily at the allosteric and post-translational level, not at the mRNA level.
In environmental microbiology, total carbohydrate content in bacterial cultures and biofilms reflects extracellular polymeric substance production, carbon storage, and metabolic status. The DNS method has been validated for total sugar determination in corn stover hydrolysates, where it quantifies the starch polysaccharides and oligosaccharides that constitute the fermentable carbohydrate fraction, while the strong acid hydrolysis conditions specified in the protocol exclude cellulose that remains undegraded. A study integrating the DNS method into laboratory curriculum noted that it provides a reliable, quantitative measure of total carbohydrates across diverse food sample types, within a framework adaptable to biological matrices ranging from plant tissue to microbial fermentation broth.
In diabetes and metabolic disease research, total carbohydrate quantification in serum, plasma, and tissue extracts provides a metabolic snapshot complementary to individual glucose measurements. While glucose alone indicates the concentration of a single monosaccharide at a single time point, total carbohydrate captures the broader pool of circulating and tissue-resident sugars, oligosaccharides, and glycated proteins that reflect integrated metabolic status over longer timescales. The carbohydrates detection service market was valued at 1.446 billion by 2032, with a CAGR of 6.6%, driven by rising demand in diabetes diagnostics and research, food and beverage quality control, and biopharmaceutical process monitoring. Total carbohydrate assay kits constitute a core tool within this expanding analytical landscape.
The kit components are deliberately minimal: Hydrochloric Acid, Sodium Hydroxide, DNS Reagent, and a Standard. Storage is valid for 12 months under the conditions specified, and shipping is on gel packs with blue ice. The usage notes reflect standard laboratory safety practice: Hydrochloric Acid and Sodium Hydroxide have certain corrosive properties, and DNS Reagent has certain toxicity, requiring appropriate protective measures during handling. Do not mix components between different batch numbers and manufacturers. Avoid bubbles while mixing. Change pipette tips frequently. Ensure all components and equipment are at the proper temperature before starting. If the sample value exceeds the maximum standard value, further dilute the sample with distilled water and multiply by the dilution factor when calculating results. These are the ordinary courtesies that any colorimetric assay demands, stated transparently.
The product page indicates zero publications citing KTB1350 at present. For a recently launched kit whose detection chemistry—the DNS method—is among the most extensively validated and widely used colorimetric carbohydrate assays in the history of analytical biochemistry, zero citations reflects launch timing, not analytical validity. The kit enters a research landscape where the DNS method has been independently validated across sample types ranging from food products to plant tissue to microbial fermentation broths, where it has been demonstrated to produce results statistically equivalent to HPLC, and where its resistance to the interferences that plague enzymatic glucose-specific assays makes it the method of choice for laboratories working with complex biological matrices. KTB1350 packages this century-old validated chemistry into a four-component, pre-formulated kit that eliminates the reagent-preparation burden that has historically restricted DNS-based total carbohydrate quantification to laboratories with dedicated carbohydrate chemistry expertise.
For the plant physiologist comparing carbohydrate allocation between drought-stressed and well-watered cultivars across a 200-sample time course, the cancer biologist screening glycogen accumulation in a panel of tumor cell lines, the environmental microbiologist quantifying extracellular polysaccharide production in biofilm-forming bacteria, the food scientist measuring total sugar content in processed food samples, or the basic metabolism researcher performing any experiment in which total carbohydrate content is a primary endpoint, direct chemical quantification using the DNS method provides the analytical robustness that enzymatic glucose-specific methods cannot deliver in complex biological matrices. The reducing sugars liberated by acid hydrolysis react with DNS reagent under alkaline heating to produce a reddish-brown chromophore at 540 nm whose absorbance is linearly proportional to the total carbohydrate concentration in the original sample. The reaction has been working reliably since the early twentieth century. It is now available in a four-component kit.
Explore specifications, access the protocol, and place your order here: https://www.abbkine.com/product/chekine-micro-total-carbohydrate-assay-kit-ktb1350/