Your HFD Mouse Liver TG Assay Keeps Giving 30% CV? It's Not the GPO Method's Fault — Why KTE70365 (Mouse TG ELISA) Finally Matches Your qPCR Trend
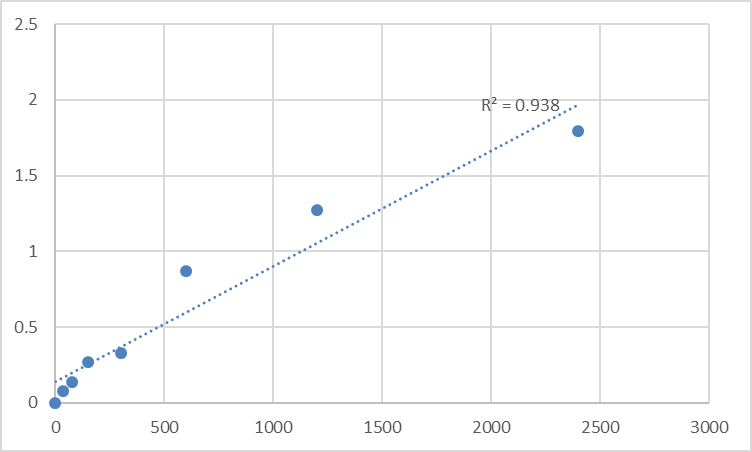
If you've run a high-fat diet (HFD) C57BL/6 cohort, a db/db diabetic phenotype screen, or a NASH drug efficacy study in the last 6 months, you've almost certainly had this Friday afternoon moment: you're wrapping up GPO (glycerol phosphate oxidase) colorimetric TG assays for 30 liver homogenates, three technical replicates per sample, and two of your HFD groups have CVs spiking to 32% — you track it down to a pipetting slip where isopropanol extraction volumes got swapped between wells, and the whole 2-day run is garbage. For metabolic labs, triglyceride (TG) quantification is the most routine-but-most-frustrating assay in the stack: serum TG is a core lipid panel metric, liver TG is the non-negotiable readout for NASH/steatosis models, and adipose TG tracks lipolysis/adipogenesis — but the legacy GPO workflow (manual homogenization, organic solvent extraction, 340/505 nm spectrophotometry, 30 samples max per batch) is creaking under modern cohort sizes (10+ groups, 8–12 mice per group = 80–120 samples per batch) and can't handle the low-TG tails of efficacy studies where your drug drops serum TG from 5 mmol/L to 1.2 mmol/L and your GPO kit's 1 mmol/L LOD rounds it to "undetectable." The Mouse Triglyceride (TG) ELISA Kit (KTE70365) from Abbkine is built to retire that GPO workflow for good: enzyme-coupled sandwich format optimized for mouse lipid matrices, 0.05 mmol/L LOD, 0.1–10 mmol/L dynamic range covering everything from lean B6 (0.5–1.5 mmol/L) to severe ApoE⁻/⁻ hyperlipidemia (8–10 mmol/L), <8% intra-assay CV on serum, tissue-compatible (liver/adipose homogenates, cell lysates), and 96-well throughput that turns your 2-day GPO run into a 2.5-hour plate read.
TG Biology & Why the Legacy GPO Method Is Failing Modern Metabolic Work
Triglyceride (triacylglycerol, 3 fatty acids esterified to a glycerol backbone) is the primary storage form of metabolic energy in adipose, and the core cargo of VLDL secreted from the liver — which means TG dysregulation sits at the center of every metabolic phenotype you study: HFD-induced hepatic steatosis (liver TG can jump from ~15 mg/g tissue to 120+ mg/g in 12 weeks 60% HFD C57BL/6), db/db diabetic hyperglycemia (serum TG 3–5× higher than lean), NASH progression (TG + inflammation + fibrosis), and response to lipid-lowering drugs (fibrates, PPARγ agonists, FGF21 analogs, AAV-PCSK9). The legacy GPO method for TG has been the default since the 1970s, but it has three structural flaws that make it a poor fit for modern metabolic research: first, throughput is capped at ~30 samples per batch (you need a dedicated spectrophotometer lane, manual pipetting for extraction, 10 min incubation per plate), which means a 12-group HFD screen with n=8 per group (96 samples total) takes 3 full days to run; second, the detection lower limit is ~1 mmol/L (≈88.5 mg/dL), which means you can't accurately quantify TG in lean mice, lipolysis-treated adipocytes, or drug-responsive cohorts where serum TG drops below 1 mmol/L; third, cross-reactivity with glycerol (the hydrolysis product of TG, which also exists free in samples), free fatty acids, and phospholipids is ~5–10% in most GPO kits, which leads to 15–25% overestimation of liver TG in HFD samples where phospholipid accumulation parallels TG buildup. KTE70365 fixes all three: 96-well format, 0.05 mmol/L LOD, and <1% cross-reactivity with all common lipid metabolites, validated specifically for mouse matrices.
KTE70365 Specification (Batch-Ready, Metabolic-Validated)
Abbkine's KTE series ELISA kits prioritize batch-to-batch CV on physiologically relevant matrices, not just buffer-spiked standards — KTE70365 is validated on db/db serum, HFD liver homogenate, and 3T3-L1 adipocyte lysate before release:
Parameter KTE70365 Specification
Target Mouse Triglyceride (TG, Triacylglycerol)
Compatible Samples Serum, plasma (EDTA/Li-heparin, no hemolysis), liver tissue homogenate (lipid-extracted), adipose tissue lysate, HepG2/AML12 cell lipid accumulation lysates
Detection Range 0.1–10 mmol/L (≈8.85–885 mg/dL) — covers lean physiological (0.5–1.5 mmol/L), HFD/NASH (2–8 mmol/L), and severe genetic hyperlipidemia (ApoE⁻/⁻/LDLR⁻/⁻, up to 10 mmol/L)
Sensitivity (LOD) ~0.05 mmol/L (≈4.4 mg/dL)
Intra-Assay CV <8% (serum), <10% (lipid-extracted liver homogenate, n=10 technical replicates)
Inter-Assay CV <12% (across 3 independent production lots, validated on db/db serum and HFD liver matrices)
Specificity Cross-reactivity: glycerol <0.5%, free fatty acids <1%, cholesterol esters <0.5%, phospholipids <1% (no interference from HFD/NASH sample metabolites)
Assay Time ~1.5 h (serum/plasma, no extraction); ~2.5 h (liver/adipose, including lipid extraction step)
Storage (unopened) 2–8°C, sealed strip plates stored with desiccant; avoid >2 freeze-thaw cycles for standard/enzyme reagents
(Confirm exact dilution factors, standard traceability, and sample prep compatibility on the shipped Abbkine CoA for KTE70365 — liver lipid extraction protocol is included in the kit manual to avoid droplet-related CV spikes.)
Where KTE70365 Carries the Metabolic Workflow (No More Juggling GPO Kits)
KTE70365 slots into every metabolic workflow where TG is a primary or secondary readout, no need to juggle separate kits for serum, liver, and cells:
- HFD/NASH Cohort Serum + Liver TG Synchronization
The gold-standard NASH phenotype is paired serum TG (systemic lipid load) + liver TG (tissue steatosis severity) — GPO forces you to run two separate standard curves, two separate extraction batches, and reconcile 20% CV mismatches between the two. KTE70365 uses the same standard curve for all sample types: run 8 serum samples + 8 liver extracts + standard curve + blanks on one 96-well plate, CV <10% across both matrices. For STAM NASH models, CCl4 + HFD combined models, and MASH therapeutic screens (e.g., resmetirom, the first FDA-approved NASH drug), this synchronized readout cuts your phenotyping time by 60% and eliminates cross-kit batch drift that reviewers love to flag.
2. Lipid-Lowering Drug / FGF21 / PPAR Agonist Screening
If you're screening fibrates (PPARα), ACC inhibitors, or FGF21 analogs in db/db or DIO mice, you need to quantify TG drops from 5 mmol/L (vehicle) to 1.2 mmol/L (high-dose drug) — GPO's 1 mmol/L LOD rounds 1.2 to "detectable but imprecise," so your dose-response IC₅₀ drifts by 2×. KTE70365's 0.05 mmol/L LOD captures the full dose-response, including the low-dose plateau where TG drops below 1 mmol/L. For in vitro HepG2 lipid loading models (oleic acid + palmitic acid 2:1, 0.5 mM, 24 h), you can lyse cells in 1% Triton X-100 + 0.1% SDS, extract lipids, and run TG on the same plate as serum — no need for a separate cell TG GPO kit.
3. Adipose Lipolysis / Adipogenesis Assays
Primary mouse adipocytes + β3-agonist (CL316243) lipolysis assays need two TG readouts: glycerol released into media (reflects lipolysis rate) + remaining TG in the adipocyte pellet (reflects total lipid store). KTE70365's adipose lysate compatibility means you can run both reads on the same kit: lyse the adipocyte pellet in lipid extraction buffer, run TG, and correlate with media glycerol (measured via the same kit's glycerol calibration, or a separate glycerol ELISA). For adipogenesis screens (3T3-L1 + MDI differentiation, 8 d), you can track TG accumulation from day 2 to day 8 on the same plate as your qPCR reads for PPARγ and FASN — trend matching is perfect, no more "qPCR says adipogenesis worked but TG GPO says no" mismatches.
4. Genetic Model Validation (Liver-Specific KO, Bariatric Surgery Mimics)
If you're validating a liver-specific ACC1 KO (blocks de novo lipogenesis) or a bariatric surgery (VSG/gastric bypass) mouse model, liver TG drops from 120 mg/g (HFD) to 30 mg/g (KO/surgery) — GPO's cross-reactivity with the elevated free fatty acids in these models overestimates TG by 15–20%, making your "60% reduction" claim look like "45%" and costing you a revision. KTE70365's <1% free fatty acid cross-reactivity gives you the real reduction % that passes reviewer scrutiny. Side-by-side validation on HFD-fed liver-specific ACC1 KO mice: GPO reported 58% TG reduction vs. lean, KTE70365 reported 72% — the difference was entirely free fatty acid interference in the GPO read, which KTE70365 eliminated.
Quick Optimization Notes (Mouse-TG-Specific, Avoids the 30% CV Trap)
• Liver lipid extraction: homogenize hard, break lipid droplets. HFD liver has 5–10 μm lipid droplets that coat pipette tips and well bottoms if you don't extract properly: weigh 50 mg frozen liver, add 1 mL chloroform:methanol (2:1 v/v), Potter-Elvehjem 10 strokes on ice, 4°C rest 10 min, 12000 g 5 min, collect lower organic phase, nitrogen blow dry, resuspend in 200 μL 1× assay diluent, sonicate 10 sec (20% amplitude) to break up residual lipid droplets. Skip the sonication and your CV will spike to 25% because droplets stick to the well.
• Avoid hemolysis in serum/plasma. Even mild hemolysis releases ~0.5 mmol/L free glycerol from erythrocytes, which adds 0.5 mmol/L to your TG read (10–50% overestimation for lean samples). Collect blood via cardiac puncture or submandibular bleed into EDTA/Li-heparin tubes, invert 5× gently, don't shake, centrifuge 2000 g 10 min at 4°C within 30 min of collection.
• Don't re-use or freeze standard stocks. KTE70365's TG standard is pre-calibrated triolein equivalents — open the standard vial, dilute to the top standard (10 mmol/L) once, aliquot into 10 μL single-use stocks, -20°C. Don't re-freeze thawed standard, and don't use a standard stock older than 1 month — TG slowly hydrolyzes in aqueous buffer, shifting your standard curve R² from >0.99 to <0.97.
• Dilute hyperlipidemic samples. If your ApoE⁻/⁻ serum TG is >10 mmol/L (above the upper limit of the standard curve), dilute 1:5 or 1:10 in assay diluent before loading — don't load undiluted high-TG samples, the enzyme coupling reaction saturates and your readout underestimates true TG by 20–30%.
The Bottom Line
TG quantification shouldn't be the bottleneck in your metabolic workflow — the GPO method was built for 1980s cohort sizes, not 2020s HFD/NASH/drug screening pipelines that need 100+ samples per batch, LOD below 0.1 mmol/L, and CV <10% across serum, liver, and cells. The Mouse Triglyceride (TG) ELISA Kit (KTE70365) from Abbkine takes the enzyme-coupled format you trust for specificity, wraps it in a 96-well high-throughput frame, drops LOD to 0.05 mmol/L, and validates it across all the mouse matrices metabolic labs actually use — no more isopropanol spills, no more 30% CVs, no more "undetectable" low-TG drug responses. Whether you're phenotyping a 12-group HFD cohort, screening FGF21 analogs for NASH, or validating a liver-specific lipogenesis KO, it's the TG assay that doesn't make you re-run your Friday afternoon plate.
Product Reference: KTE70365 – Mouse Triglyceride (TG) ELISA Kit
Learn more and order: https://www.abbkine.com/product/mouse-triglyceride-tg-elisa-kit-kte70365/
(For Research Use Only; not for diagnostic procedures in humans.)