The Glutathione Number Everyone Wants—And the 5 µL Kit That Finally Gets It Right Without the GSH Contamination
There is a specific silence that descends on a redox biology lab meeting when someone presents their GSSG data and the ratio doesn‘t make sense. The GSH measurement looked perfect. The total glutathione concentration fell within the expected range for that cell type, that treatment, that time point. But when the GSSG values were plugged into the equation, the resulting GSH/GSSG ratio—the number that every reviewer, every grant committee, every textbook says defines cellular redox state—indicated an oxidative environment so severe the cells should have been dead. The cells were not dead. The measurement was wrong. And in most cases, the error traces back not to the pipetting, not to the extraction, but to a biochemical betrayal built into the detection chemistry itself: the glutathione reductase cycling assay, the most widely used method for GSSG quantification, cannot fully distinguish the oxidized disulfide from the reduced monomer because GSH is present at concentrations 100- to 1,000-fold higher than GSSG in physiological samples. A 2025 Abbkine technical blog states the problem plainly: most kits can‘t fully eliminate reduced glutathione, leading to inflated GSSG numbers that turn a promising hypothesis into a guessing game. The error is not marginal. It is systematic, it is directional—always overestimating GSSG, always making the cell look more oxidized than it actually is—and it has been quietly distorting the redox biology literature for decades.
Abbkine’s CheKine™ Micro Glutathione Oxidized (GSSG) Assay Kit (KTB1610) enters this analytical landscape with a design that addresses the GSH contamination problem at the sample-preparation stage rather than at the detection stage, and the distinction is biochemically decisive.
The detection chemistry is the well-validated DTNB-based enzymatic cycling method that has been the gold standard of glutathione quantification since its introduction by Tietze in 1969. Reduced glutathione in the sample reacts with DTNB to generate 2-nitro-5-mercaptobenzoic acid, which has maximum light absorption at 412 nm. Glutathione reductase then reduces GSSG to GSH, and the resulting thiol groups react with DTNB to produce additional yellow chromophore—the absorbance increase at 412 nm is directly proportional to the GSSG content of the well. This is the same chemistry that has anchored glutathione measurement for over half a century. What KTB1610 changes is what happens before the DTNB enters the reaction: the kit includes a GSH removal step—an immobilized glutathione reductase column that strips away 99% of GSH before the assay. No more contamination worries. No more inflated GSSG numbers. No more redox ratios that suggest oxidative catastrophe when the cells are perfectly viable. The signal at 412 nm reflects GSSG content, not GSSG-plus-residual-GSH, and the distinction is what separates a redox measurement that can be defended under peer review from one that cannot.
The microscale capability of KTB1610 is the feature that the Abbkine technical blog positions as the kit’s defining operational advantage. Reactions run in 96-well plates with just 5–10 µL of sample—10× less than standard kits that typically demand 50–100 µL, enabling researchers to extract more data from precious clinical specimens such as cerebrospinal fluid and neonatal plasma, or from tiny model organisms including zebrafish larvae. This sample economy is not a marginal improvement; it is what enables GSSG quantification in the limited biological matrices where the GSH/GSSG ratio matters most. A single mouse hippocampus yields enough lysate for triplicate GSSG measurements plus a protein assay and a separate GSH determination, rather than being exhausted by the GSSG measurement alone.
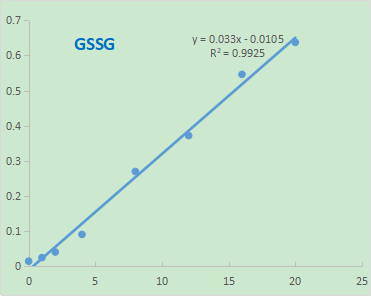
The analytical specifications are calibrated to the biological reality of glutathione quantification rather than to marketing convenience. The calibration range spans 1–20 µM with a minimum detection concentration below 1 µM. The technical blog further documents a linear range of 0.1–10 µM covering physiological serum levels of approximately 0.5–2 µM to pathological levels exceeding 5 µM in oxidative stress models, with a limit of detection reaching 0.05 µM that captures subtle changes in low-abundance systems such as mitochondria. This sensitivity margin matters in practical terms. Unstimulated primary hepatocytes, resting lymphocytes, and quiescent stem cells all produce GSSG concentrations that fall within the lowest quartile of many commercial assay kits‘ detection windows. KTB1610 captures them without requiring sample concentration, lyophilization, or pooling that introduces systematic error.
The anti-interference formulation of KTB1610 addresses the matrix effects that have historically made GSSG quantification unreliable in the biological samples where measurement matters most. The assay buffer includes EDTA to chelate metals that catalyze GSH autoxidation to GSSG during sample processing, and BSA to block non-specific protein binding that can sequester the DTNB chromophore or the glutathione reductase enzyme. For hemolyzed serum—a common clinical sample type in which hemoglobin released from lysed red blood cells generates a red-brown background absorbance at 412 nm that swamps the DTNB signal—and for lipemic plasma that scatters light and elevates baseline absorbance, the kit‘s buffer system suppresses interference that generic DTNB-based assays cannot control. Traditional methods such as HPLC and ELISA are precise but require large sample volumes exceeding 100 µL and extended run times, while conventional colorimetric kits fail under pressure from common interferents including hemolyzed blood, lipemic serum, and trace metals that send absorbance readings haywire. KTB1610’s anti-interference buffer converts these problematic sample types from analytical failures into quantifiable data points.
The kit components reflect the biochemical minimalism that the DTNB-GR cycling method permits: Extraction Buffer, Inhibitor, Assay Buffer, GR, GR Cofactor, Chromogen, and Standard—seven items. No separate glutathione reductase to source from specialty suppliers. No DTNB powder to weigh, dissolve, and protect from light with paranoid urgency. The 2-vinylpyridine inhibitor is included for derivatizing GSH in the sample, a step that prevents the residual GSH from participating in the cycling reaction and generating false GSSG signal. Storage is at -20°C protected from light, with a 12-month stability window from receipt, and shipping occurs on gel packs with blue ice. The protocol notes reflect genuine analytical discipline: if the experiment is not carried out immediately, the sample can be kept at -80°C for 10 days; all samples should be diluted 1:10 with deionized water and the result multiplied by the dilution factor; always prepare fresh standards per use as diluted standard solution is unstable and must be used within 4 hours. These are the ordinary courtesies that any enzymatic cycling assay demands, and the protocol states them clearly.
Sample compatibility spans the full range of biological matrices in which GSSG is biologically and clinically relevant: serum, plasma, plant tissues, cell lysates, and other biological fluids. The inclusion of plant tissues alongside animal samples is not a marketing afterthought—it acknowledges that glutathione is the master antioxidant across all eukaryotes, and that plant redox biology laboratories measuring GSSG accumulation under drought, salinity, heavy metal, and pathogen stress face the same interference challenges as mammalian redox biology laboratories. The GSH/GSSG ratio is the main indicator of the cell’s redox state, and measuring the content of GSH and GSSG and their ratio in cells reflects the redox state of cells.
The publication record for KTB1610 provides independent validation that no manufacturer‘s internal QC dataset can replicate. At the time of writing, the product has been cited in 2 peer-reviewed publications. One of those citations appears in CNS Neuroscience & Therapeutics (impact factor 5), where the kit was deployed to demonstrate that DMT1 ubiquitination by Nedd4 protects against ferroptosis after intracerebral hemorrhage—a context in which GSSG accumulation is the direct biochemical readout of the lipid peroxide-induced glutathione oxidation that defines ferroptotic cell death, and in which the accuracy of the GSSG measurement determines whether the ferroptosis mechanism is correctly assigned or attributed to the wrong pathway. The kit enters a research landscape where ferroptosis has exploded from a niche cell-death curiosity into one of the most intensively studied mechanisms in neurodegeneration, ischemia-reperfusion injury, and cancer therapy, and where the quality of the GSSG measurement is the single most important analytical variable in the entire ferroptosis experimental workflow.
The broader biomedical context makes the case for reliable, interference-resistant GSSG quantification increasingly urgent across multiple research domains. The ratio between reduced and oxidized glutathione is the main indicator of the cell‘s redox state, and GSSG is reduced back to GSH by glutathione reductase under physiological conditions, maintaining the predominantly reduced environment that cellular metabolism requires. When oxidative stress overwhelms this system, GSSG accumulates, the GSH/GSSG ratio collapses, and the consequences cascade through Nrf2 signaling, NF-κB activation, mitochondrial permeability transition, and ultimately apoptosis or ferroptosis. In neurodegeneration, GSSG accumulation in the substantia nigra and cortex correlates with disease progression in Parkinson’s and Alzheimer‘s disease. In cancer, the GSH/GSSG ratio predicts sensitivity to chemotherapy, radiation, and ferroptosis-inducing agents. In cardiovascular disease, GSSG levels in plasma and atherosclerotic plaques reflect the oxidative burden that drives endothelial dysfunction. In plant biology, GSSG accumulation under stress conditions is a quantitative marker of oxidative damage. In every one of these contexts, the accuracy of the GSSG measurement is what separates a study that correctly characterizes redox status from a study that reports inflated GSSG numbers because the kit could not remove GSH before the assay.
The economic accessibility of KTB1610 deserves direct statement because it differentiates the kit from the premium-priced alternatives with which its analytical performance competes. The product page on abbkine.com indicates that the kit provides a broad range linearity of 1–20 µM with a minimum detection concentration below 1 µM, and that it is designed for the determination of GSSG content in serum, plasma, plant tissues, cell lysates, and other biological fluids. For a redox biology laboratory studying ferroptosis in primary neurons, a plant physiology group measuring oxidative stress under drought, a clinical researcher profiling GSH/GSSG ratios in patient plasma, or an undergraduate biochemistry teaching laboratory, the availability of a microscale, GSH-depleted, anti-interference GSSG assay kit converts glutathione oxidation measurement from a specialized analytical procedure into a routine redox parameter.
The glutathione number that everyone wants—the GSSG concentration that, when combined with GSH, produces the ratio that defines cellular redox state, that determines whether a cell survives oxidative stress or undergoes ferroptosis, that tracks with neurodegeneration and cardiovascular disease and cancer chemoresistance, that has been systematically overestimated for decades by kits that could not eliminate GSH contamination—can now be measured with a kit that strips away 99% of GSH before the DTNB ever enters the reaction, requires just 5–10 µL of sample, detects GSSG down to 0.05 µM across a linear range of 0.1–10 µM, incorporates EDTA and BSA to suppress the interference that hemolyzed and lipemic samples introduce, ships at -20°C with a 12-month shelf life, and has already been cited in a ferroptosis study published in CNS Neuroscience & Therapeutics. The 412 nm absorbance is proportional to the GSSG content. The GSH is removed. The interference is suppressed. The sample volume is 5–10 µL. The standard curve is provided. The protocol is seven components. The storage is 12 months. The citations are two.
Explore specifications, access the protocol, and place your order here: https://www.abbkine.com/product/chekine-micro-glutathione-oxidized-gssg-assay-kit-ktb1610/