How to draw ELISA standard curve with CurveExpert 1.4 Software
The standard curve of ELISA generally uses special curve fitting tools, such as: CurveExert 1.4. CurveExpert 1.4 is a comprehensive curve fitting system for Windows. XY data can be modelled using a toolbox of linear regression models, nonlinear regression models, interpolation, or splines.
Next, we will take Curve Exert1.4 as an example to briefly introduce how to make the standard curve of ELISA:
- Start "Curve Expert 1.3" software.
- Enter the OD value of the standard on the X axis and the corresponding concentration value on the Y axis, as shown below:
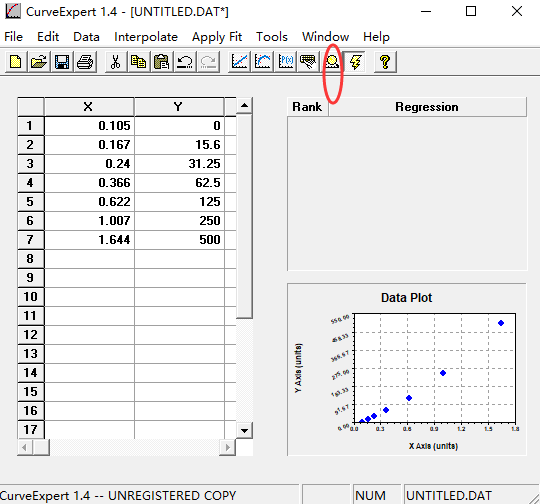
- Click the [Run] button (red circle above), and the following dialog box appears:
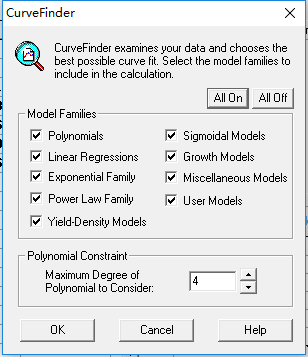
4. Click the [0K] button, the following two dialog boxes appear, and close the next one:
Close the next dialog box:
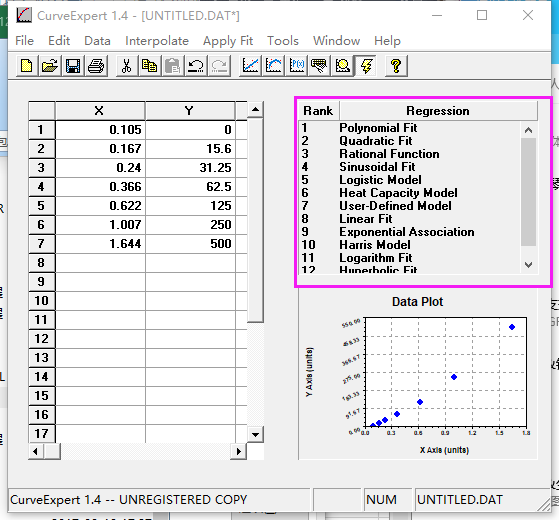
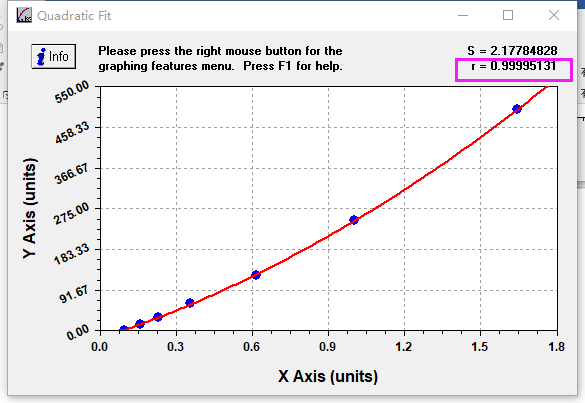
5. Some curve names appear in the upper right corner of the dialog box. Click the curve names in turn from "1", and the corresponding fitted curves will appear in the upper right corner:
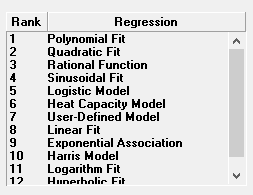
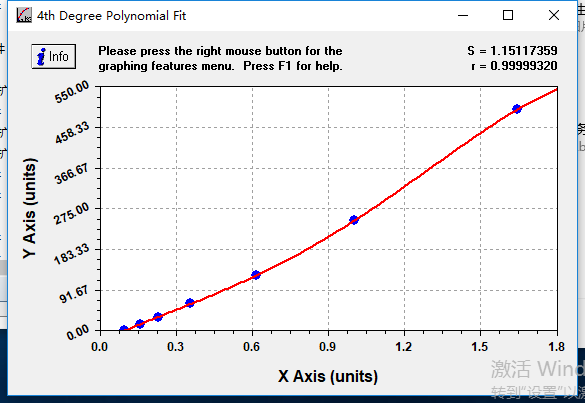
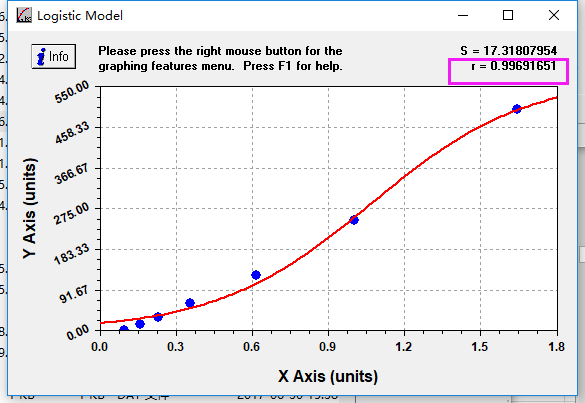
6. Double-click the curve with the best ELISA fitting degree according to the fitting curve, and the following dialog box appears:
Note: Select the curve equation with the best coefficient (“r value”) for operation. In the upper right corner of the dialog box below, there is a “r value”. And the closer “r value” is to 1, the better the fitting degree.
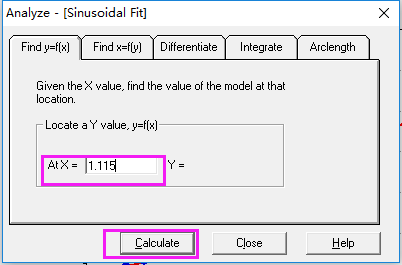
7. Press the [Ctr] key + [L] key(or click the right mouse button on the interface above, the analyze option appears), and the following dialog box will appear:
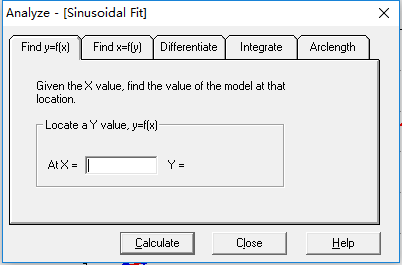
8. Enter the standard OD value and click [Calculate] to get the actual content of the protein to be tested (The specimen is diluted N times, and the calculated value should be multiplied by N ).
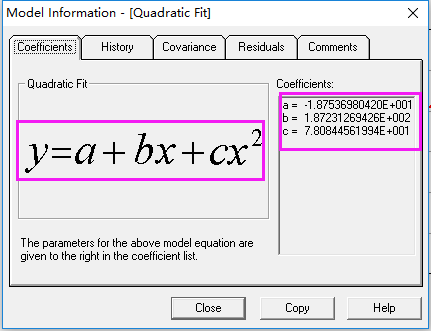
9. To obtain the equation of the ELISA fitting curve, click "Info "in the upper-left corner of the dialog box in Step 6.
10. Get the following dialog box and Click "Copy". Paste it where you want to get the following data:
Rational Function: y=Y=a+bx+cx2
When the concentration of antigen or antibody is too high, the corresponding ELISA reading will no longer increase significantly, reaching a plateau, and there will also be a plateau at low concentration. A curve similar to a straight line will appear only when the concentration is appropriate. Therefore, multi-parameter fitting is required for general data to obtain a curve that can more accurately reflect the experimental results. Sigmoid Logistic curve is commonly used.
Click on the link below to download the CurveExert 1.4 software
https://www.abbkine.com/curveexert-1-4-software