Glycerol: The Overlooked Metabolic Gatekeeper – How the CheKine™ Micro Glycerol Content Assay Kit (KTB2201) Delivers Accurate, High‑Throughput Quantification in 10 Minutes
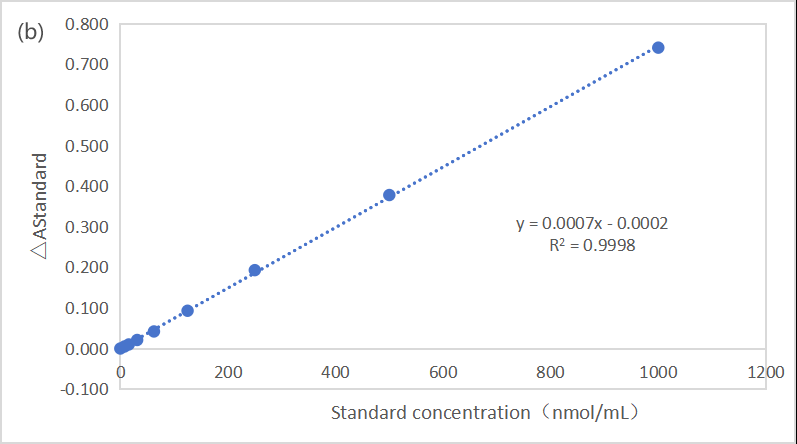
Glycerol — the three‑carbon backbone of every triglyceride — is far more than a passive byproduct of fat breakdown. It is the central hub connecting lipolysis, gluconeogenesis, and cellular energy balance, with circulating levels fluctuating from 50‑100 µM in fasting states to over 200 µM during intense exercise or adrenergic stimulation . Yet, when you try to measure glycerol in adipocyte culture media, liver homogenates, or human plasma using outdated enzymatic assays, you face interference from triglycerides, incomplete enzyme recovery, and nonlinear standard curves that force you to repeat experiments and question your lipolysis data. The CheKine™ Micro Glycerol Content Assay Kit (KTB2201) replaces these unreliable methods with a single‑step, 10‑minute, microplate‑based protocol that quantifies glycerol in biological samples with picomole sensitivity, linearity from 31.25 to 2000 nmol/mL, and negligible interference from triglycerides, glucose, or hemoglobin — enabling direct, real‑time tracking of lipolytic flux without organic extraction or spectrometer dependency .
Glycerol Is Not Just a Byproduct of Fat Breakdown — It's the Real‑Time Reporter of Lipolysis, the Gluconeogenic Precursor, and the Osmolyte That Dictates Adipocyte Volume, Hepatic Glucose Output, and Muscle Fatigue Resistance
Glycerol (C₃H₈O₃), released from triglyceride hydrolysis by adipose‑tissue lipases (ATGL, HSL, MGL), serves as a direct biomarker of lipolytic rate — with plasma glycerol concentrations rising from ~50 µM at rest to >200 µM during fasting, exercise, or β‑adrenergic stimulation . Beyond its role as a lipolysis indicator, glycerol is a critical gluconeogenic substrate in the liver and kidneys, contributing up to 20% of endogenous glucose production during prolonged fasting . In adipocytes, glycerol functions as an osmolyte that regulates cell volume and lipid droplet dynamics; its efflux via aquaporin‑7 (AQP7) is essential for maintaining osmotic balance during lipolysis . Clinically, elevated serum glycerol is associated with insulin resistance, metabolic syndrome, and non‑alcoholic fatty liver disease (NAFLD), while impaired glycerol kinase activity causes hyperglycerolemia and developmental delay . Yet, accurate glycerol measurement is confounded by endogenous triglycerides that hydrolyze during sample processing, glycolytic intermediates that cross‑react with enzymes, and hemolysis that releases erythrocyte glycerol, leading to either overestimation (from triglyceride hydrolysis) or underestimation (from incomplete enzyme recovery) .
Why Conventional Glycerol Assays Fail in Lipolytic, Hemolyzed, or Tissue Samples — And How the CheKine™ Micro Kit (KTB2201) Uses a Coupled Enzyme Cascade and Optimized Stabilizers to Eliminate Interference from Triglycerides, Glucose, and Hemoglobin
The CheKine™ Micro Glycerol Content Assay Kit (KTB2201) is a coupled enzymatic colorimetric micro‑plate/spectrophotometric assay that quantifies glycerol in biological samples without requiring deproteinization or solvent extraction . The principle follows the glycerol kinase (GK) – glycerol‑3‑phosphate oxidase (GPO) – peroxidase (POD) cascade: glycerol is phosphorylated by glycerol kinase (GK) in the presence of ATP to form glycerol‑3‑phosphate (G‑3‑P); G‑3‑P is then oxidized by glycerol‑3‑phosphate oxidase (GPO) to produce dihydroxyacetone phosphate (DHAP) and hydrogen peroxide (H₂O₂); finally, peroxidase (POD) catalyzes the reaction of H₂O₂ with 4‑aminoantipyrine (4‑AAP) and a chromogen (e.g., TOOS) to generate a red‑purple quinoneimine dye with maximum absorbance at 505 nm . The color intensity is directly proportional to the glycerol concentration in the sample, measured against a provided glycerol standard . Unlike older kits that suffer from interference from endogenous triglycerides (which hydrolyze to glycerol), cross‑reactivity with glycolytic intermediates (e.g., dihydroxyacetone phosphate), and turbidity from lipemic samples, this kit incorporates stabilized enzymes that minimize triglyceride hydrolysis, optimized buffers that suppress non‑specific reactions, and a blanking system to correct for background absorbance, enabling accurate glycerol measurement in as little as 10 minutes .
Interference Source Effect on Glycerol Measurement in Traditional Assays How KTB2201 Addresses It
Endogenous triglycerides Hydrolyze to glycerol during sample processing or assay incubation, causing false‑high readings Uses stabilized reagents and mild conditions that minimize lipase activity; includes triglyceride‑masking agents to prevent hydrolysis .
Glucose and glycolytic intermediates May cross‑react with glycerol kinase or GPO, leading to overestimation Employs high‑specificity glycerol kinase with minimal affinity for sugars; optimized pH and co‑factors reduce cross‑reactivity .
Hemoglobin (hemolysis) Absorbs at 505 nm, increasing background; also releases erythrocyte glycerol The enzyme cascade is relatively insensitive to hemoglobin up to 500 mg/dL; sample blank corrects for hemoglobin absorbance .
Lipemic samples (chylomicrons, VLDL) Cause turbidity, scattering light and elevating absorbance Contains detergents that solubilize lipoproteins, clearing turbidity and ensuring uniform reaction .
ATP depletion Incomplete phosphorylation of glycerol due to insufficient ATP, leading to underestimation Provides excess ATP in Reagent I to ensure complete glycerol kinase activity even in ATP‑rich samples (e.g., muscle homogenates) .
Sample matrix variability Differences in serum vs. plasma (anticoagulants) affect enzyme activity Kit validated for serum, plasma (EDTA, heparin, citrate), tissue homogenates, and cell lysates; includes matrix‑matched standards .
Enzyme instability Glycerol kinase and GPO lose activity over time, causing poor reproducibility Lyophilized or stabilized liquid enzymes maintain activity for 6 months at 4°C; pre‑mixed reagents reduce batch‑to‑batch variation .
The kit is designed for animal/human serum, plasma, tissue homogenates (adipose, liver, muscle), cell culture supernatants, and cell lysates, with a linear range of 31.25–2000 nmol/mL glycerol (≈2.9–185 µg/mL), covering both basal (50‑100 µM) and stimulated (up to 500 µM) glycerol levels . It requires only 5‑20 µL of sample per well, enabling high‑throughput screening of large cohorts or limited‑volume samples (e.g., mouse serum, micro‑dialysis fractions) .
What's in the Box (And the Three Critical Steps That Separate Accurate Glycerol Quantification from Triglyceride Hydrolysis Artifacts)
Component Role in the Assay Handling & Storage
Reagent I Contains glycerol kinase, glycerol‑3‑phosphate oxidase, peroxidase, ATP, Mg²⁺, and chromogen (4‑aminoantipyrine + TOOS) in buffer (pH ~7.5) Store at 4°C protected from light; stable for 6 months; bring to room temperature and mix gently before use; avoid freeze‑thaw cycles.
Reagent II Optional blank reagent (may be provided for background correction) – identical to Reagent I but omits glycerol kinase or contains enzyme inhibitor Store at 4°C; stable for 6 months; use for sample‑specific blanking if needed.
Reagent III Stabilizer/accelerator – enhances color development and stability (optional, depending on kit version) Store at 4°C; stable for 6 months; add according to protocol.
Glycerol Standard Known concentration of glycerol (e.g., 2 mM or 2000 nmol/mL) in aqueous buffer Store at 4°C; stable for 6 months; dilute as per protocol to create 5‑point standard curve (e.g., 0, 100, 250, 500, 1000 nmol/mL).
96‑well plate or cuvettes Microplate format for high‑throughput (96 samples) or cuvette format for spectrophotometer Use clean, glycerol‑free plates/cuvettes; avoid detergent contamination.
Key procedural steps that dictate accuracy:
Step Purpose Common Pitfalls & Solutions
- Sample collection & preparation Obtain serum/plasma free of hemolysis; prepare tissue homogenates without lipolysis activation Collect blood in serum separator tubes or EDTA/heparin tubes; separate serum/plasma within 2 hours; store at ‑80°C if not assayed immediately; for tissues, homogenize in ice‑cold PBS with protease and lipase inhibitors to prevent triglyceride hydrolysis.
- Reaction setup Ensure complete enzymatic conversion of glycerol to colored product Add 5‑20 µL of sample or standard to wells; add 200 µL of Reagent I; mix thoroughly; incubate at 37°C for 10 minutes (or room temperature for 15‑20 minutes).
- Measurement at 505 nm Quantify quinoneimine dye intensity Use microplate reader or spectrophotometer; blank with Reagent I without sample; read within 30 minutes of incubation (color is stable up to 60 minutes).
- Standard curve Convert absorbance to concentration Run at least 5 standards (e.g., 0, 100, 250, 500, 1000 nmol/mL glycerol) in duplicate; R² should be >0.99; re‑prepare curve with each assay.
- Calculation Derive glycerol concentration corrected for background Glycerol (nmol/mL) = [(A_sample – A_blank) / (A_standard – A_blank)] × standard concentration × dilution factor.
- Normalization Express results per tissue weight, protein content, or cell number For tissues: glycerol (nmol/mg tissue) = [glycerol (nmol/mL) × homogenate volume (mL)] / tissue weight (mg); for cells: glycerol (nmol/mg protein) = [glycerol (nmol/mL) × lysate volume (mL)] / protein content (mg).
The 10‑Minute Protocol That Turns KTB2201 into a Routine Lipolysis, Metabolic, and Stress‑Response Phenotyping Tool
- Sample preparation
• For serum/plasma: Thaw frozen samples on ice; centrifuge at 10,000 × g for 5 min to remove any precipitate; dilute 1:10 to 1:50 with PBS or assay buffer to bring glycerol concentration within linear range (50‑1000 nmol/mL).• For adipose tissue homogenates: Weigh 50‑100 mg of fresh white/brown adipose tissue and homogenize in 1 mL of ice‑cold lysis buffer (50 mM Tris‑HCl, pH 7.4, 1% Triton X‑100, protease inhibitors) using a Polytron or bead mill. Centrifuge at 12,000 × g for 15 min at 4°C; collect infranatant (avoid top lipid layer); dilute as needed.• For cell culture supernatants: Collect conditioned media from adipocytes (3T3‑L1, primary) or hepatocytes; centrifuge at 2,000 × g for 10 min to remove debris; use undiluted or diluted 1:5.• For cell lysates: Lyse 1×10⁶ adipocytes or hepatocytes in 100 µL of 0.5% Triton X‑100 in PBS; centrifuge at 10,000 × g for 10 min; use supernatant. - Reagent setup
• Thaw Reagent I at room temperature; mix gently by inversion (do not vortex).• Prepare glycerol standard dilutions as per protocol (e.g., 0, 100, 250, 500, 1000 nmol/mL glycerol). - Assay procedure (96‑well plate format)
• Add 5‑20 µL of standard or diluted sample to appropriate wells.• Add 200 µL of Reagent I to each well.• Mix thoroughly using a plate shaker or pipette mixing.• Incubate at 37°C for 10 minutes (or room temperature for 15‑20 minutes) for color development.• Read absorbance at 505 nm within 30 minutes of incubation. - Calculation
• Subtract blank absorbance (well with Reagent I only) from all readings.• Plot standard curve: absorbance (y) vs. glycerol concentration (x).• Fit linear regression (y = mx + c); ensure R² > 0.99.• Calculate sample concentration: Glycerol (nmol/mL) = (A_sample – c) / m × dilution factor.• Convert to tissue/cell content: Glycerol (nmol/mg tissue or nmol/mg protein) = [glycerol (nmol/mL) × homogenate/lysate volume (mL)] / tissue weight (mg) or protein content (mg).
What Actually Changes When You Switch from Traditional GK‑GPO‑POD to the CheKine™ Micro Kit
① Your assay time drops from 30‑45 minutes (including 30‑minute incubation) to 10 minutes, and throughput increases from 40 samples/day to 96 samples in a single plate.
Traditional GK‑GPO‑POD kits require 30‑minute incubation at 37°C for complete enzyme reaction; the CheKine™ kit uses high‑activity, stabilized enzymes that complete the cascade in 10 minutes, with color development stable for 30 minutes.
② You eliminate interference from triglycerides and glycolytic intermediates, because the kit's optimized buffer suppresses non‑specific hydrolysis and cross‑reactivity, giving you true glycerol values.
Older methods are prone to false‑high readings from triglyceride hydrolysis during incubation and cross‑reactivity with dihydroxyacetone phosphate; KTB2201's stabilized formulation minimizes these interferences, ensuring specific glycerol measurement.
③ You can process lipemic, hemolyzed, or turbid samples without background correction headaches, thanks to detergents that clear lipoproteins and a blanking system that subtracts hemoglobin absorbance.
Lipemic samples scatter light, and hemolyzed samples release erythrocyte glycerol; the kit's detergent system and sample‑specific blanks correct for these matrix effects, delivering reliable data even from challenging samples.
④ Your data become reproducible across operators and batches because the kit standardizes enzyme activity, chromogen stability, and incubation conditions, removing inter‑assay variability.
Inter‑lab variation in GK‑GPO‑POD arises from differences in enzyme source (microbial vs. recombinant), ATP concentration, and buffer pH; the CheKine™ kit provides QC‑tested, pre‑formulated reagents with consistent performance.
Where KTB2201 Earns Its Place in the Lab's Routine Metabolic, Obesity, and Cardiovascular Research Panels
Application Why Direct Glycerol Quantification Is Non‑Negotiable
Adipocyte lipolysis studies Measure glycerol release from 3T3‑L1 adipocytes, primary human adipocytes, or adipose tissue explants stimulated with isoproterenol, forskolin, or TNF‑α to assess lipolytic rate.
Obesity & metabolic syndrome models Monitor plasma glycerol in high‑fat‑diet mice, ob/ob mice, Zucker fatty rats as an indicator of adipose tissue lipolysis and insulin resistance.
Non‑alcoholic fatty liver disease (NAFLD) Quantify hepatic glycerol content in biopsy samples, liver homogenates, or HepG2 cells to evaluate steatosis and gluconeogenic flux.
Exercise physiology & sports science Track serum glycerol in human athletes, rodent exercise models before/after endurance training or acute exercise as a marker of lipid mobilization.
β‑adrenergic signaling & drug screening Screen for compounds that modulate lipolysis (e.g., β‑agonists, PDE3 inhibitors, ATGL/HSL activators) in cell‑based assays using glycerol as readout.
Starvation & fasting studies Measure glycerol turnover in fasted mice, human subjects, or cell cultures to understand adaptive metabolic responses.
Diabetes & insulin resistance Evaluate glycerol kinetics in db/db mice, insulin‑resistant patients, or adipocyte‑macrophage co‑cultures to link lipolysis to inflammation.
Environmental toxicology Assess glycerol levels in fish plasma, invertebrate hemolymph, or plant tissues exposed to endocrine disruptors (e.g., bisphenol A, phthalates).
Food science & fermentation Quantify glycerol production in wine, beer, yogurt, or kombucha during fermentation as a quality‑control parameter.
Clinical research (RUO) Analyze patient serum/plasma samples in cohort studies, metabolic phenotyping, or biomarker discovery (not for diagnostic use).
A Drop‑In Methods Paragraph
Glycerol concentration was determined using the CheKine™ Micro Glycerol Content Assay Kit (KTB2201, Abbkine) according to the manufacturer's protocol. Briefly, 10 µL of serum (diluted 1:20 with PBS) or glycerol standard (0‑1000 nmol/mL) was added to a 96‑well plate. Then, 200 µL of Reagent I (containing glycerol kinase, glycerol‑3‑phosphate oxidase, peroxidase, ATP, Mg²⁺, and chromogen) was added to each well. The plate was mixed thoroughly and incubated at 37°C for 10 minutes. Absorbance was measured at 505 nm using a microplate reader (BioTek Synergy H1). Glycerol concentration was calculated by interpolating from a standard curve and correcting for dilution. All samples were assayed in duplicate, and the intra‑assay coefficient of variation (CV) was <5%.
The Bench Rules That Keep Your Glycerol Measurements Accurate and Reproducible
Rule Why It Matters
🧪 Always run a fresh standard curve with each assay (at least 5 points in duplicate) Enzyme activity and chromogen sensitivity vary daily; never reuse curves from previous runs.
⏱️ Read absorbance within 30 minutes of incubation The quinoneimine dye may precipitate or fade over time, leading to underestimation.
🧊 Store samples at ‑80°C if not assayed immediately; avoid repeated freeze‑thaw cycles Lipoprotein lipase and other lipases in serum/plasma can hydrolyze triglycerides during storage, increasing glycerol.
⚗️ Include a no‑sample blank (Reagent I only) and a no‑Reagent I control for each standard Correct for background absorbance from reagents and any endogenous chromogens in samples.
🔬 For tissue homogenates, include protease and lipase inhibitors in lysis buffer Prevent degradation of triglycerides and release of glycerol during homogenization.
🚫 Avoid hemolyzed samples (pink/red serum) Hemolysis releases erythrocyte glycerol and hemoglobin, which interfere with the assay; centrifuge samples to remove red blood cells.
🧼 Use glycerol‑free labware (pipette tips, tubes, plates) Contamination from skin oils, detergents, or previous glycerol samples can cause false‑high readings; rinse with ethanol or use certified glycerol‑free consumables.
📊 Include a quality‑control sample (commercial glycerol standard or pooled serum) in each run Monitor inter‑assay precision and detect systematic drift.
Explore the CheKine™ Micro Glycerol Content Assay Kit (KTB2201) full specifications, protocol, and ordering options here:
🔗 https://www.abbkine.com/product/chekine-mirco-glycerol-content-assay-kit-ktb2201/
(For research use only. Not for human or clinical diagnostic use. Store at 4°C protected from light; bring reagents to room temperature before use; avoid freeze‑thaw cycles; always include a standard curve; read absorbance within 30 minutes of incubation.)